The Race Between Teacher Wages and the Budget: The Case of South Africa 2008-2018
Authors: Nic Spaull, Adaiah Lilenstein, and David Carel
Executive Summary
The aim of the present analysis is to determine how the real resources available to the average child in South Africa have changed over the period 2008 to 2018. In order to do so the paper makes the argument that existing measures of discounting educational expenditures, notably using the Consumer Price Index (CPI) are inadequate, and in our view, incorrect. They drastically over-estimate the rise in real spending on education and do not take into account the overall rise in enrolments resulting from an unusual birth-spike in 2005. Furthermore, such an approach cannot explain why there has been a simultaneous rise in “real spending” coinciding with the widespread implementation of hiring-freezes, a well-known cost-cutting measure implemented by provinces.
To remedy this, we develop the Basic Education Price Index (BEPI) which uses the prices of the real cost drivers of education in South Africa and weights them in the same proportion as that which makes up actual expenditures in the budget (Estimates of Provincial Expenditure and Revenue). Because educator wages – that is, teachers, school managers and administrators – make up approximately 80% of the education budget, changes in educator wages should be used when discounting historical educational expenditures. Put simply, we ask how much it costs to employ 100 teachers in 2008 and 100 teachers in 2018, rather than how the prices of an average basket of consumer goods (CPI) changed over the period (CPI). We argue for a method that uses the actual cost drivers in education and weights the price-basket in the same proportions as they are found in the budget, approximately 80% personnel and 20% non-personnel. Using this new and more appropriate measure, shows that real per-learner spending in South Africa has shrunk by -2,3% between 2009 and 2018, with much higher figures in some provinces.
The five main findings of the paper can be summarized as follows:
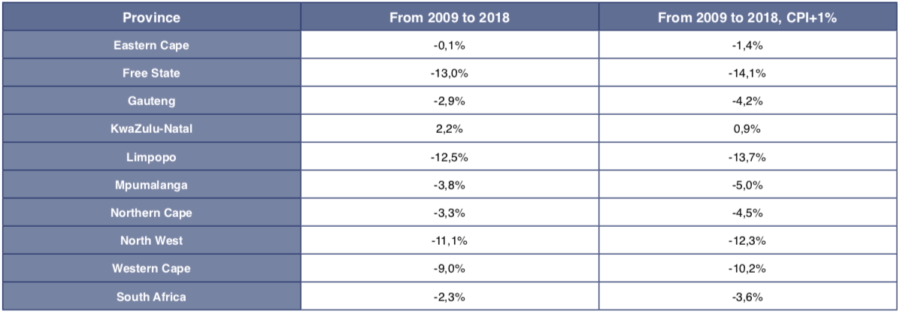
1. Clear evidence of a fiscal squeeze: Provinces are clearly facing a ‘fiscal squeeze’ where increases in teacher salaries have outpaced increases in budget allocations to education. While this has led to declines in real per learner spending of -2.3% nationally, this is considerably higher in the Free State (-13%), Limpopo (-12,5%) and the North West (-11%) between 2009 and 2018.
2. Provinces coping using hiring freezes: Provinces seem to be ‘coping’ with this squeeze by implementing cost-saving measures such as hiring freezes and leaving vacant posts unfilled. Unsurprisingly these hiring freezes are largest where the real per-learner declines are greatest. Importantly, hiring freezes are disproportionately affecting school management posts rather than regular teaching posts, although there has been a decline in the latter as well. It is uncanny how similar the declines are in per-learner spending between 2009 and 2018 to the declines in the number of principals employed between 2012 and 2016 (the years for which we have PERSAL data). In the Free State per-learner spending declined by -13%, principal posts declined by -14%. In Limpopo per-learner spending declined by -13%, principal posts declined by -13%. In the North West per-learner spending declined by -11%, principal posts declined by -12%.
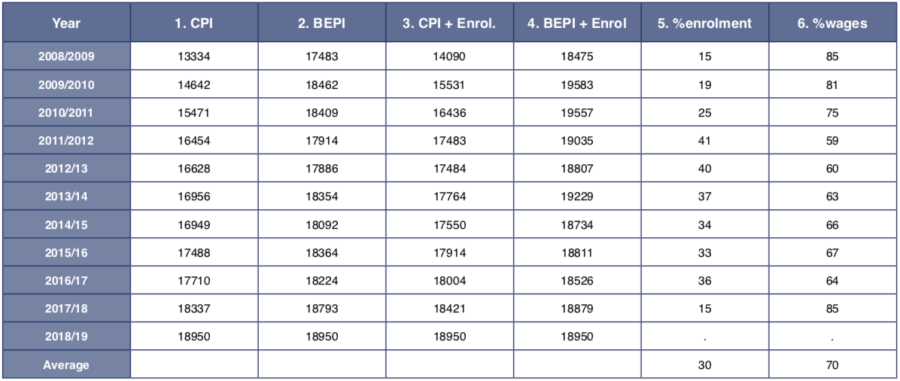
3. Historical overestimation of spending on education: We show that any historical analysis that uses CPI to discount educational expenditures overestimates the real spending on education since the real cost drivers have, especially teacher salaries, have been increasing much faster than CPI. In South Africa a traditional approach of using CPI as the discount rate leads one to conclude that ‘real’ aggregate educational expenditures have increased by 42% between 2008 and 2018, when in fact they have only increased by 8% when using the correct discount rate. Furthermore, when comparing 2009 and 2018 using CPI-discounted figures the aggregate increase was 30% when in actual fact it was only 3% when using the correct discount rate. This is primarily because the vast majority of additional educational spending over this period has simply been on paying existing teachers more, rather than hiring more teachers or buying more non-personnel resources.
4. Per-learner figures vs aggregate figures: Much of the existing literature and government reporting is at the aggregate level. Yet the meaningful unit of analysis is the child – what is available to the average child in South Africa? While this may not matter if a population is stable over time, a situation of rising births (as in South Africa) means that resources are being spread over a larger number of children than before. This makes a considerable difference to the conclusion. Between 2009 and 2018 real expenditure on education rose by 3% when looking at the aggregate level and fell by -2.3% when looking at the per-learner level (both using real cost drivers). While there was slightly more money (+3%) being spent on education in 2018 compared to 2009 when looking in the aggregate, for the average child there was slightly less money being spent on them in 2018 compared to 2009.
5. Significant inter-provincial variation in spending per child: It is clear that some provinces spend more public money per child than others, despite alleged equal funding per child in the national funding formulas. For example, Gauteng spent R2,500 more per child per year compared to KwaZulu-Natal or Limpopo (R20,037 in Gauteng compared to R17,563 in KwaZulu-Natal and R17,503 in Limpopo in 2018).
Finally, we argue that the national government has agreed to higher teacher wages and benefits without budgeting for those increases, and in the process undermined the education system. This has led to a host of unintended consequences. Provincial departments experiencing salary increases that have outpaced their budget increases have attempted to deal with the subsequent fiscal squeeze by implementing hiring freezes and allowing class sizes to rise. Payroll data shows that even after accounting for a small decline in the number of schools, there are -7% fewer principals employed in 2016 compared to 2012. In the three most severely affected provinces the declines in employed Principals, Deputy Principals and HODs range from -13% to -23% when comparing 2012 and 2016.
The main contribution of the paper, to both the research literature on South African education, and also to policymakers, is to help explain the conundrum of the co-existence of widespread hiring freezes and the alleged rising per-learner spending on education (using CPI as a deflator). The answer to this conundrum is that CPI is the wrong deflator for education – both in South Africa and internationally. When using the correct deflator (the Basic Education Price Index) there is a logical explanation behind both increases in class sizes and the implementation of hiring freezes. The provincially devolved nature of South African spending provides further corroborating evidence. Provincial disaggregation of spending trends and hiring freezes shows quite clearly that those provinces experiencing the largest declines in real per learner spending are also the ones who have the highest number of vacancies. This is not a coincidence. For those researchers who are unconvinced that BEPI is the correct discount rate, and instead believe that real education expenditures have been increasing monotonically for the last decade, we ask the following question: If real educational expenditures per learner have been rising over this period, why is it that provinces are implementing hiring freezes?
Finally, we argue that government officials from the National Treasury and the Department of Basic Education need to take account of the dynamics presented in this paper when entering wage negotiation agreements with teacher unions. While many of the choices made in such negotiations are necessarily political, it is fair to ask government to acknowledge the trade-offs and costs in their decisions and to make those trade-offs and decisions public.
Figure 1. Overview of education expenditure allocations and components in South Africa
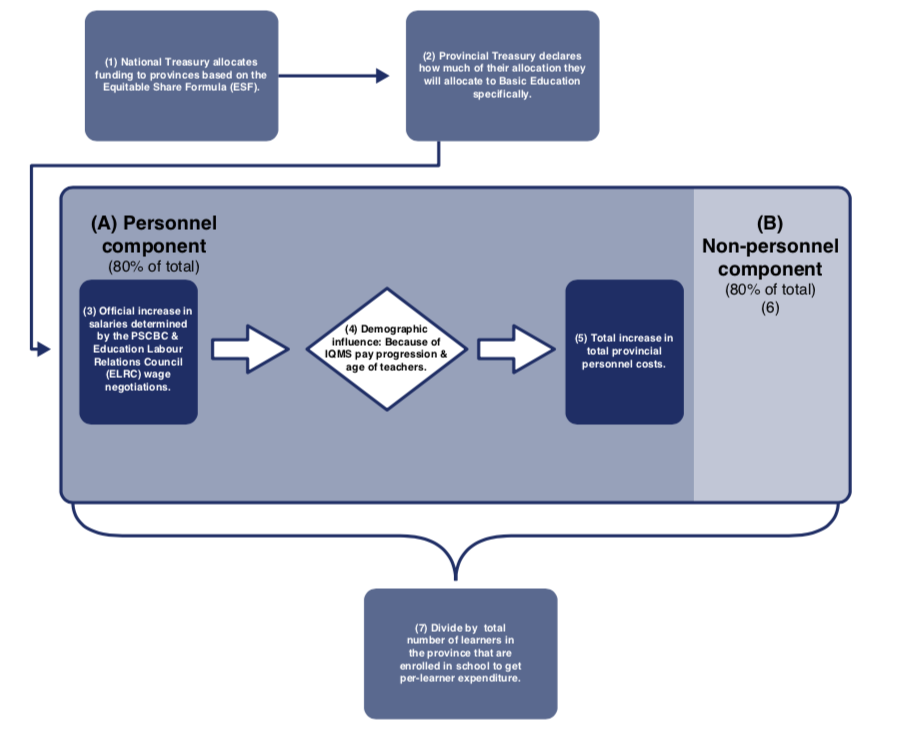
Figure 2. Example EPRE table, Western Cape 2019/20
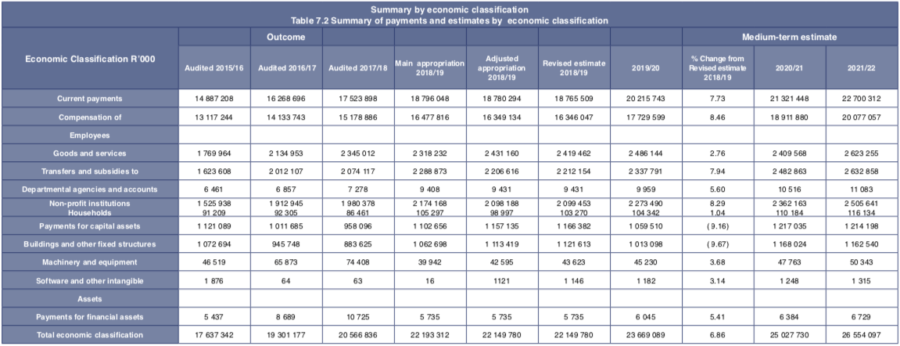
Source: National Treasury, 2019
Table 1. Reference key for EPRE source files
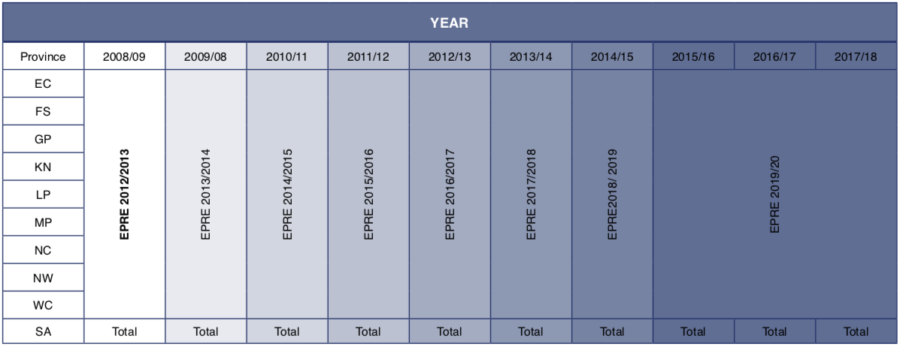
Note: At the time of writing the 2018/19 MP report had not been released. EPRE files are available at https://www.treasury.gov.za/documents/provincial%20budget/default.aspx
Figure 3. Composition of total national expenditure on education, 2008 to 2018
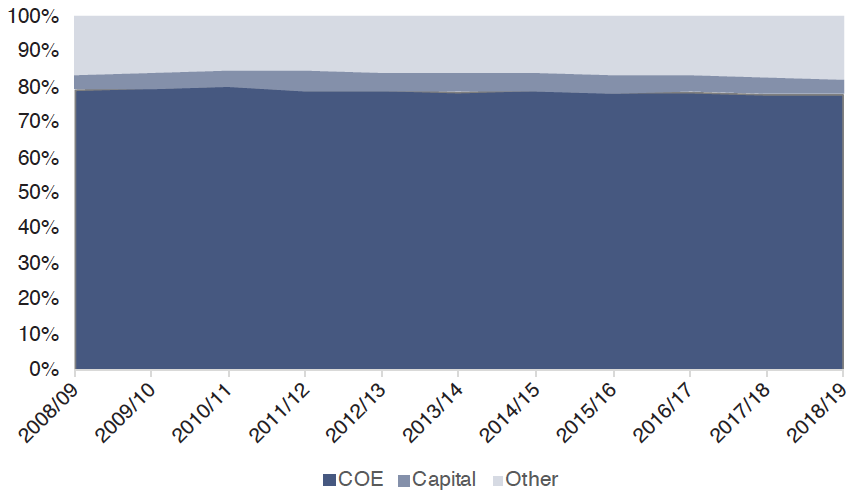
Notes: 1. Figures derived from EPRE reports. 2. COE is Cost of Employment.
Figure 4. Composition of total provincial expenditure on education, 2018/19
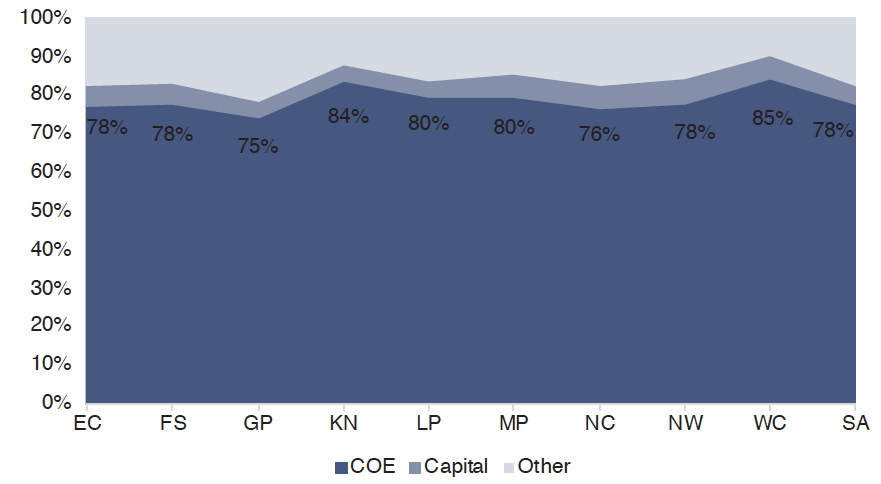
Notes: 1. Figures derived from EPRE reports. 2. Values for 2018/19 onwards are EPRE projections. COE is Cost of Employment.
Table 2. Wage inflation, 2008-2018, calculated using wage increases prescribed in Government Gazettes
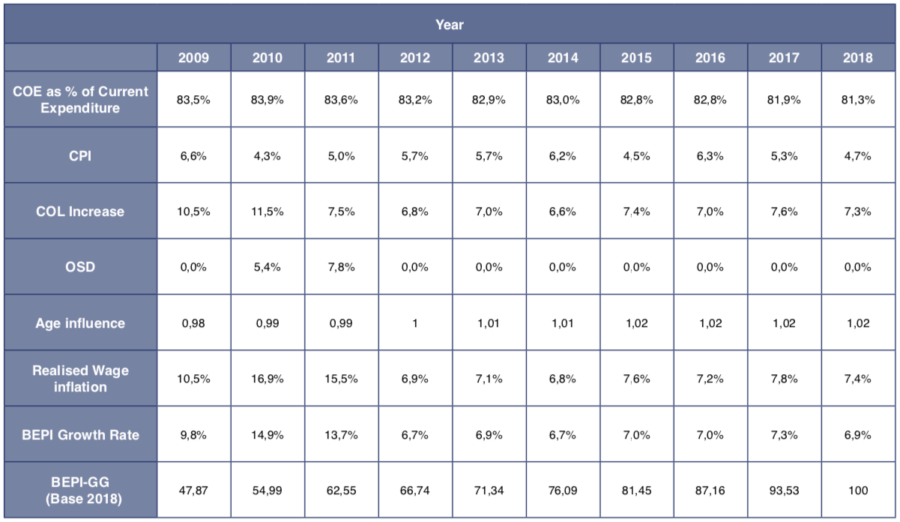
Notes: 1. Mean age 2008-2017 from Gustafsson (2019b). 2. Mean age 2018 estimated using the quadratic trend from Gustafsson (2019b). 3. Age influence takes the average age in Figure 5 and maps it onto the index of total annual cost to employer in Figure 6. 4. Official increases 2008-2018 from government gazettes. 5. Official increases for 2009 and 2017 are the average of the band given in the relevant gazette. 6. The BEPI figure for 2008 can be calculated by BEPI-GG in 2009 divided by BEPI Growth Rate on 2009, which equals 43.6.
Table 3. Wage inflation, 2008-2018, using analysis of annual change in Persal educator wages
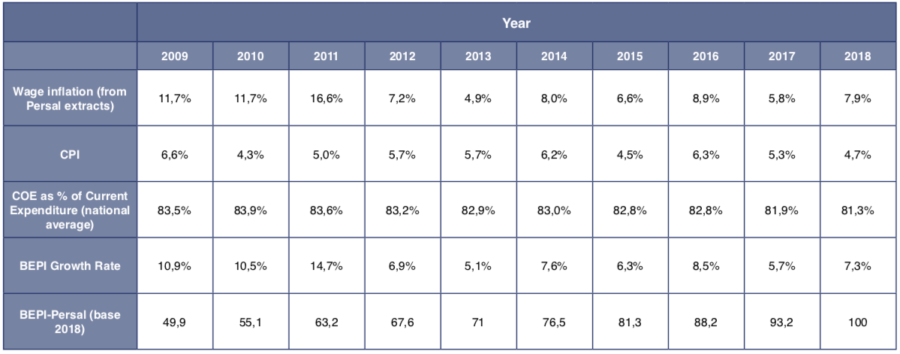
Notes: 1. Wage inflation, calculated as change in average permanent educator cost to employer 2007-2018, personal communication with Martin Gustafsson (2020) Since data was provided in 2007 but not 2008 or 2009, we calculate 2009’s Wage Inflation rate as the average annual increase from 2007 to 2010. 2. 2008-009. 3. The BEPI figure for 2008 can be calculated by BEPI-Persal in 2009 divided by BEPI Growth Rate on 2009, which equals 45. (Source for Persal: Personal communication with Martin Gustafsson, 12 March 2020).
Figure 7. National Enrolments in Public Ordinary Schools in GrR to Gr12, 2008 to 2019
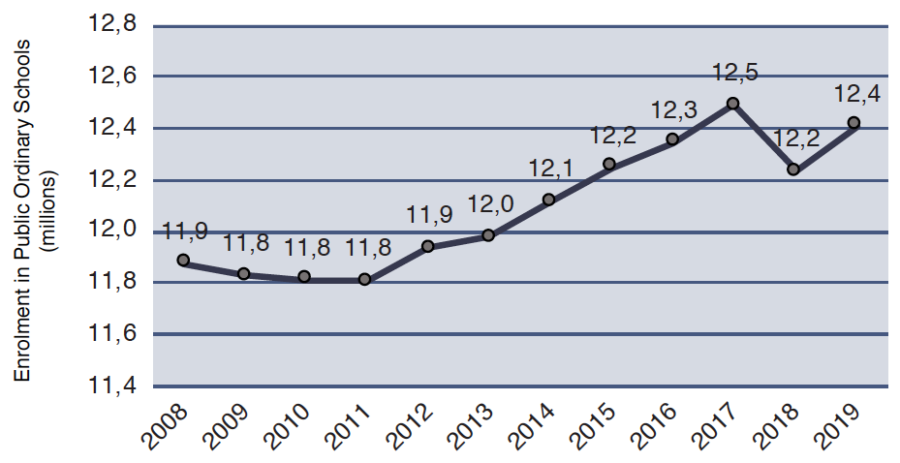
Notes: 1. Values for 2008-2019 are from DBE’s School Realities documents (2008-2018)
Figure 8. Provincial Enrolments in Public Ordinary Schools in GrR to Gr12, 2008 to 2019 (in millions of learners)
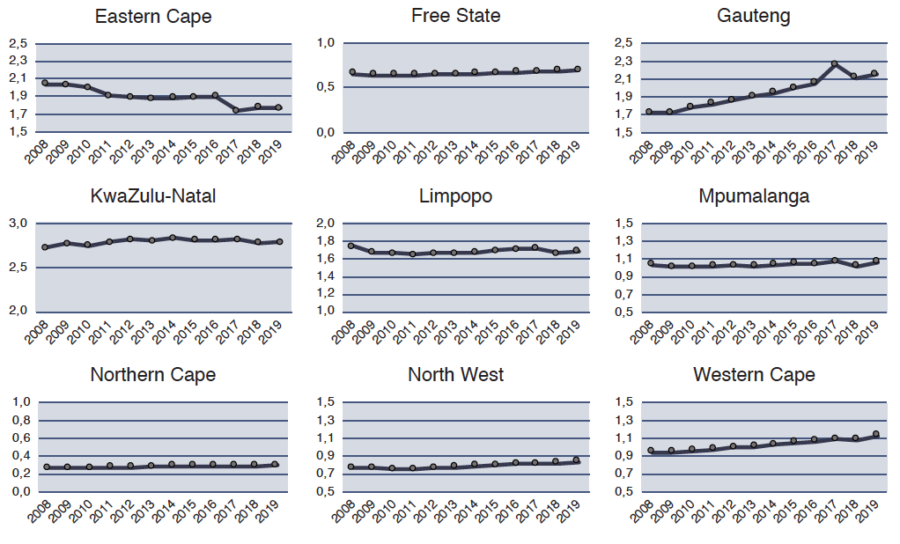
Notes: 1. Values for 2008-2019 are from DBE’s School Realities documents (2008-2019)
Figure 9. National Enrolments in Public Ordinary Schools in GrR to Gr12, 2008 to 2019
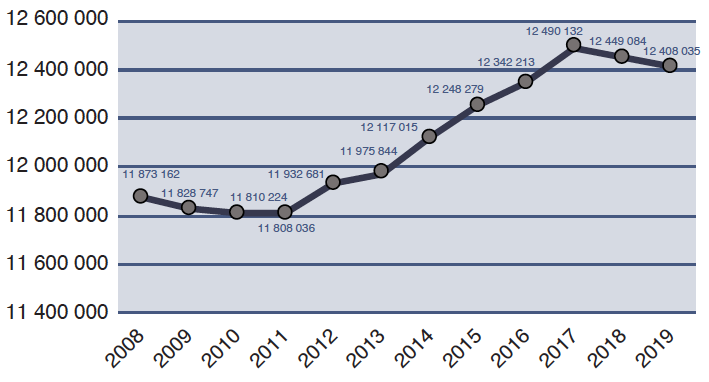
Notes: 1. Values for 2008-2019 are from DBE’s School Realities documents (2008-2019) except for 2018 which is an average of 2017 and 2019 figures.
Table 4. Wage to CPI inflation comparison
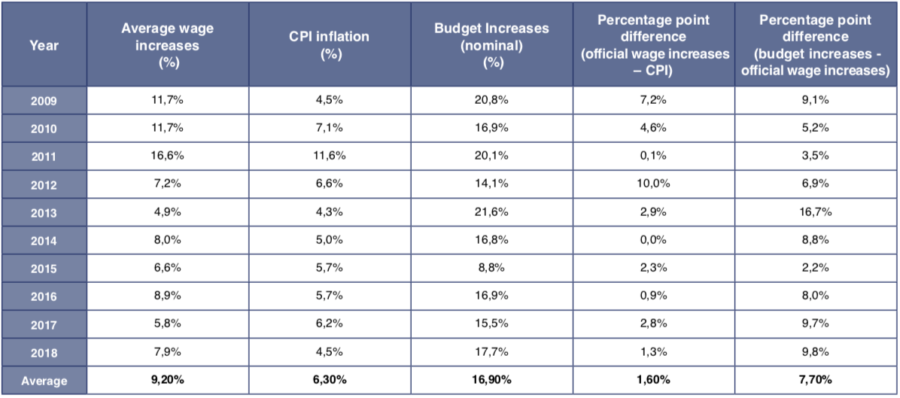
Notes: (1) Wage inflation calculated above. (2) Historical CPI figures are from StatsSA, average inflation over the year is used throughout.
Figure 10: Comparing real current expenditure when discounting by CPI and BEPI
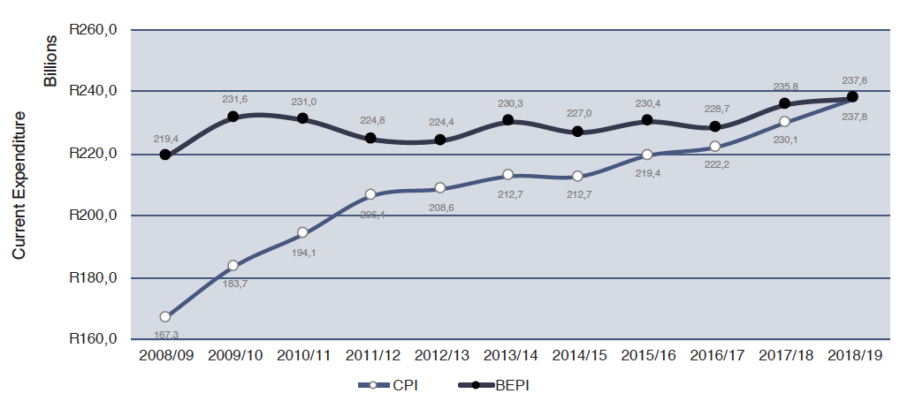
Figure 11. Comparable total expenditure per learner discounted using BEPI-Persal, (2018 Rands)
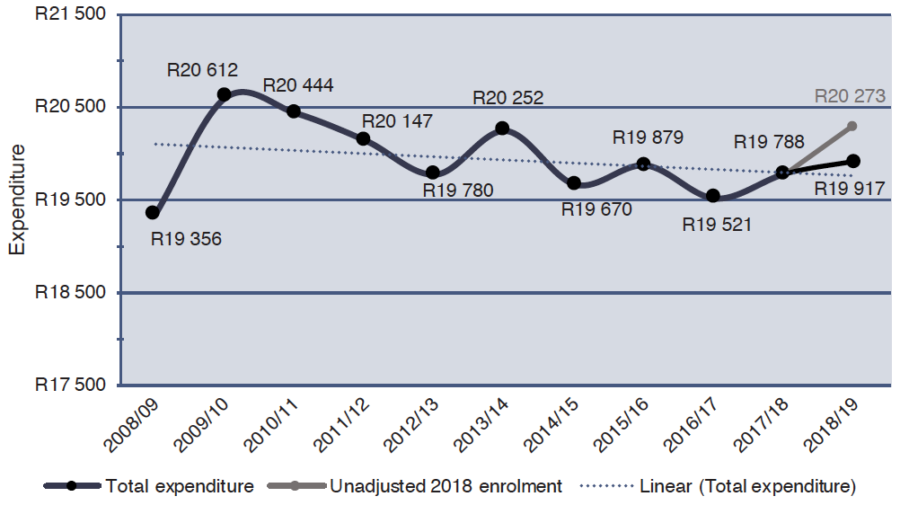
Notes: 1. Deflated using BEPI-Persal inflation index.
Figure 12. Comparable current expenditure per learner discounted using BEPI-Persal, (2018 Rands)
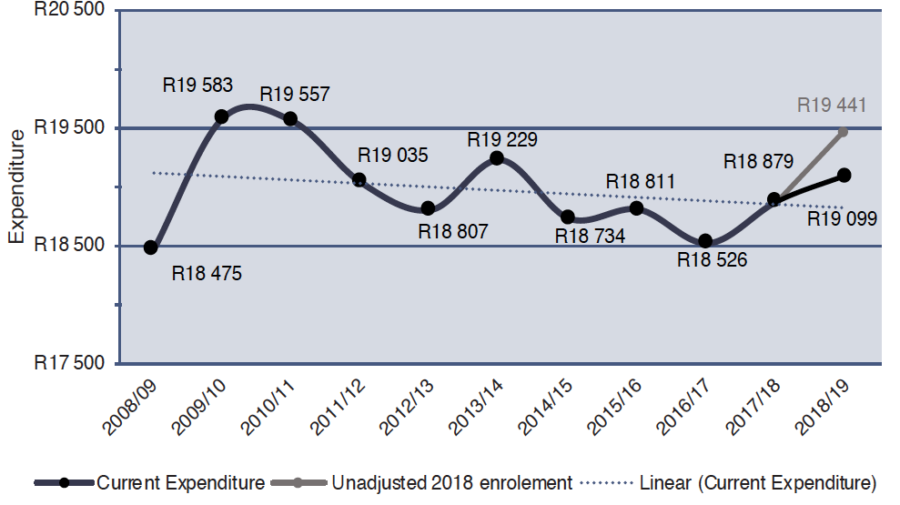
Notes: 1. Deflated using BEPI-Persal inflation index.
Table 5. Final per learner current expenditure, real 2018 Rands (using BEPI-Persal)
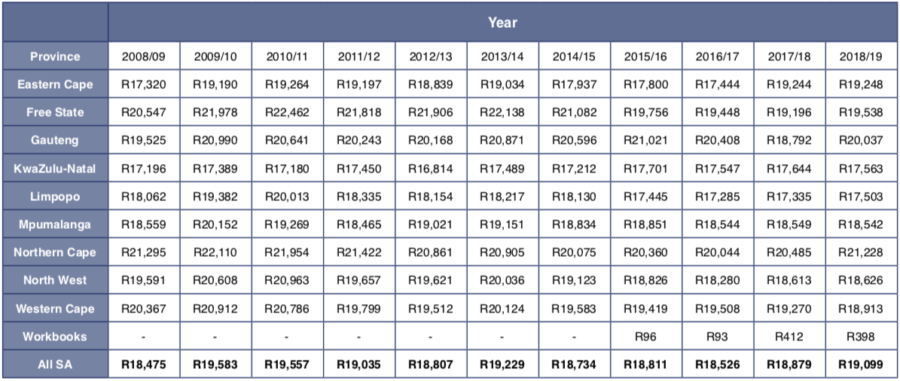
Notes: 1. Figures are derived from current expenditure and enrolment figures, the prior adjusted for inflation trends. 2. Inflation adjustments take into account CPI figures and personnel wage inflation (i.e. BEPI). 3. Workbooks refers to DBE learner workbooks which are nationally funded.
Figure 13. Provincial current expenditure per learner deflated using BEPI-Persal (2018 Rands)
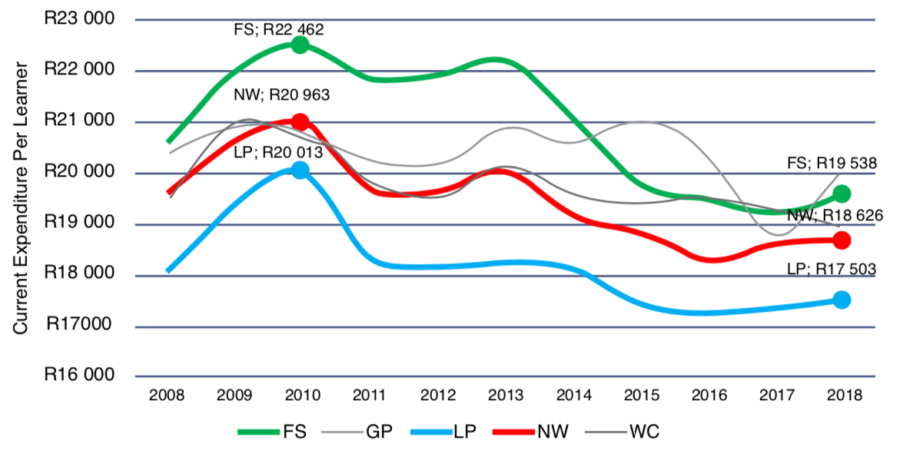
Table 6. Declines in Provincial current per Learner Expenditure using BEPI discounted values
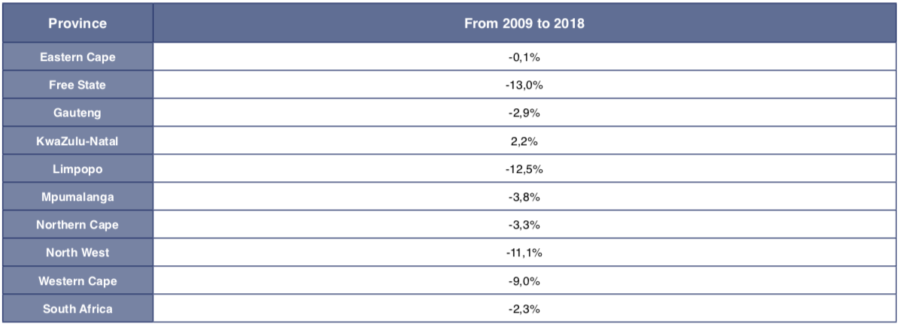
Table 7. Components of per Learner Expenditure Decreases
Note: Expenditure figures are given in 2018 Rands.
Table 8. Number of employed educators, manager educators and non-educators by province and national for 2012 and 2016
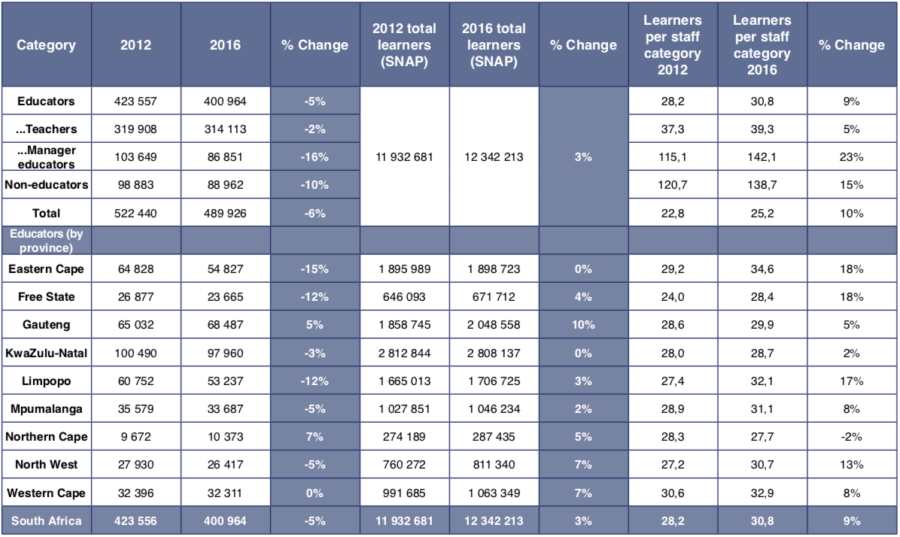
Source: Persal Nov-2012 and Nov-2016 (DBE, 2017: p.21), SNAP survey 2012
Figure 16. Percentage change in employed HOD’s, Deputy Principals and Principals in November 2012 to November 2016 (national and provincial) taking account of fewer schools. (Note: percentage calculations are (2016-2012*)/2012*) where 2012* is the 2012 number less the change in the number of schools between 2012 and 2016).
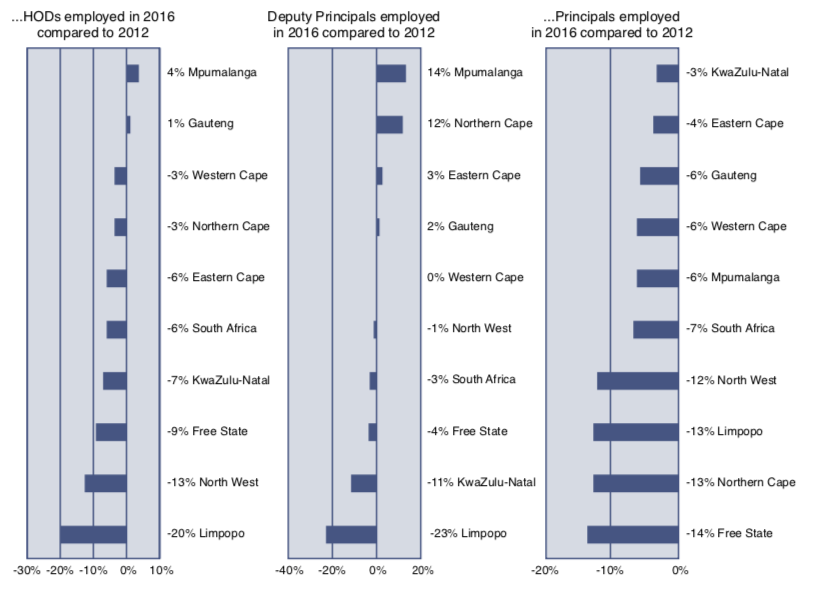
Source: Persal Nov-2012 and Nov-2016 (DBE, 2017: p.21).
Table 9. Number of employed HODs, deputy principals, and principals by province and national for 2012 and 2016
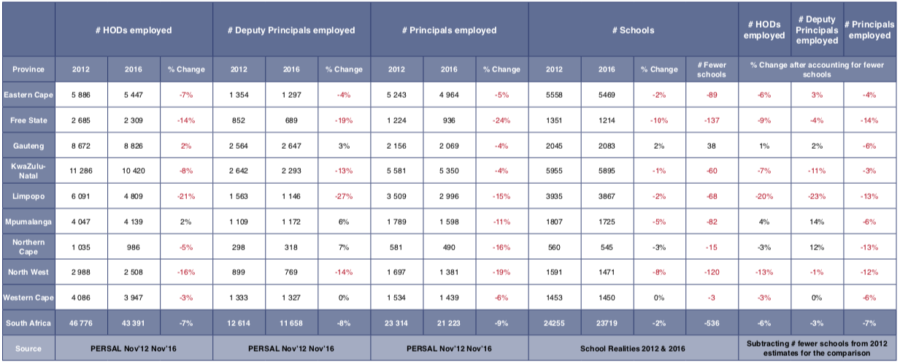
Source: Persal Nov-2012 and Nov-2016 (DBE, 2017: p.21).
Figure 17. Learner: Educator ratio trend using official aggregates (Gustafsson 2020, forthcoming)
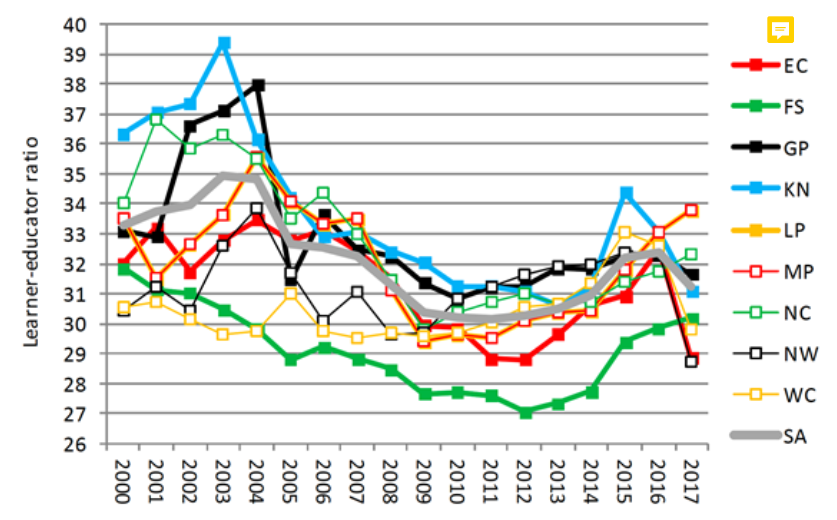
Note: Graph from Gustafsson (2020, forthcoming). Ratios are calculated from total educators and total learners (Grade R-12) appearing in the official statistical releases of the Department of Basic Education, titled School Realities and Education Statistics South Africa.
Table 10. Independent estimates of realized South African class sizes 2011-2017
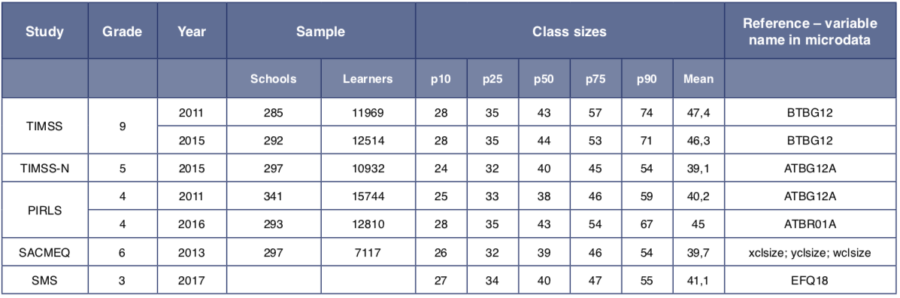
Table 11. Raw Provincial Expenditure on Education: Total expenditure including compensation of employees and capital accumulation (Millions of Rands)
Notes: 1. Figures are taken directly from EPRE files.
Table 12. Raw Provincial Expenditure on Education: Compensation of employees (R millions)
Notes: 1. Figures are taken directly from EPRE files.
Table 13. Raw Provincial Expenditure on Education: Capital accumulation (Millions of Rands)
Notes: 1. Figures are taken directly from EPRE files.
Table 14. Raw Provincial Expenditure on Education: Current expenditure (Total less capital, Millions of Rands)
Notes: 1. Figures are taken directly from EPRE files.
Table 15. Adjusted and Unadjusted Total Expenditure, 2011/12 (R Millions)
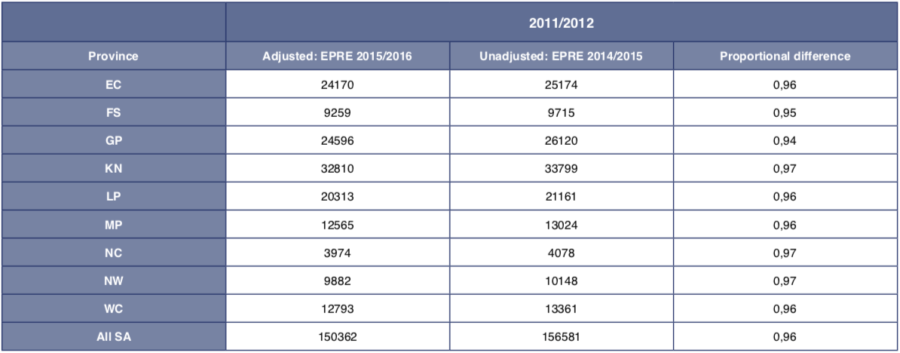
Table 16. Adjusted and Unadjusted COE, 2011/12 (R Millions)
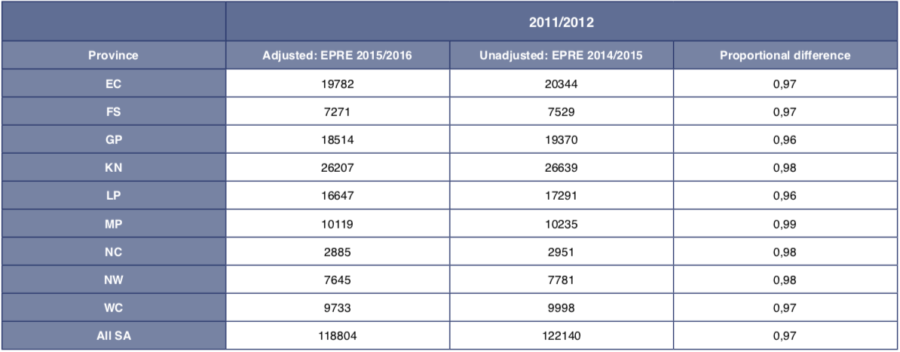
Table 17. Raw National Expenditure on Workbooks, R million
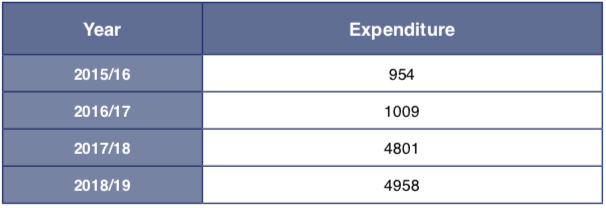
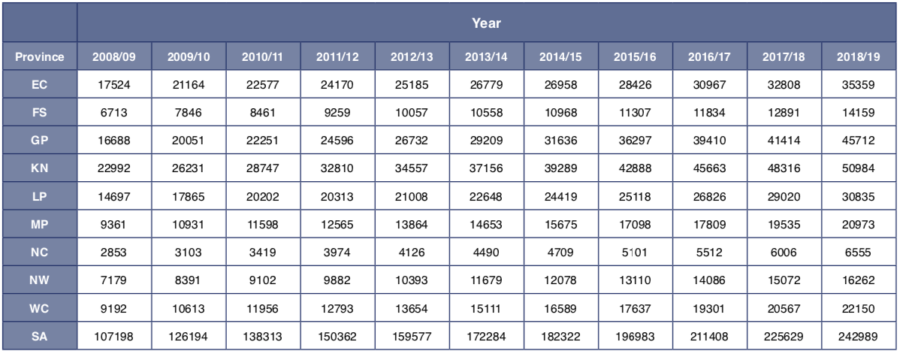
Table 18. Nominal Expenditure on Education: Total expenditure (Millions of Rands)
Notes: 1. Provincial figures are raw EPRE figures adjusted for Programme 5. 2. W.Books refers to learner workbooks which are nationally financed.
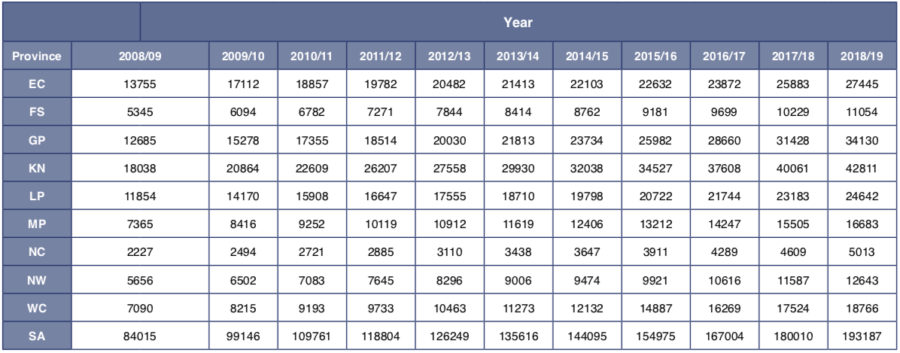
Table 19. Nominal Expenditure on Education: Compensation of employees (Millions of Rands)

Notes: 1. Provincial figures are raw EPRE figures adjusted for Programme 5.
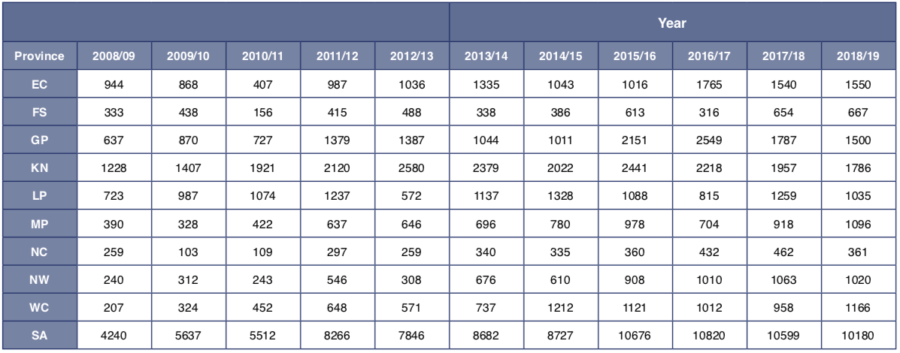
Table 20. Nominal Expenditure on Education: Capital accumulation (Millions of Rands)

Notes: 1. Provincial figures are raw EPRE figures adjusted for Programme 5.
Table 21. Nominal Expenditure on Education: Current expenditure (Millions of Rands)

Notes: 1. Provincial figures are raw EPRE figures adjusted for Programme 5. 2. W.Books refers to learner workbooks which are nationally financed.
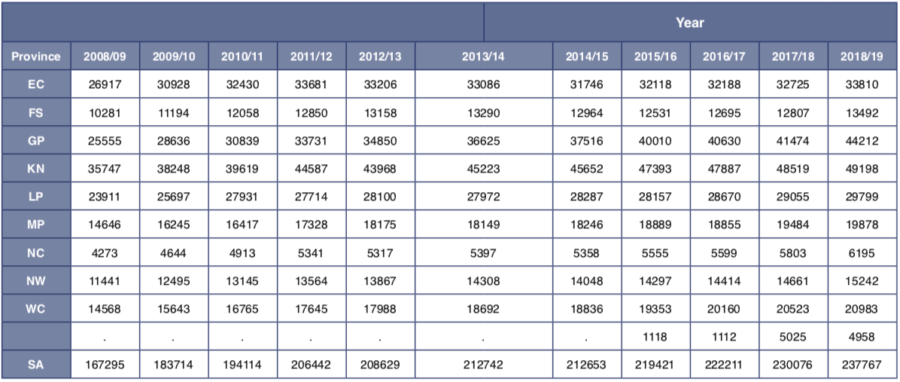
Table 22. CPI-Deflated Expenditure on Education: Total expenditure (Millions of Rands, 2018 Rands)

Notes: 1. Provincial figures are comparable nominal EPRE figures adjusted for CPI inflation. W.Books refers to learner workbooks which are nationally financed.
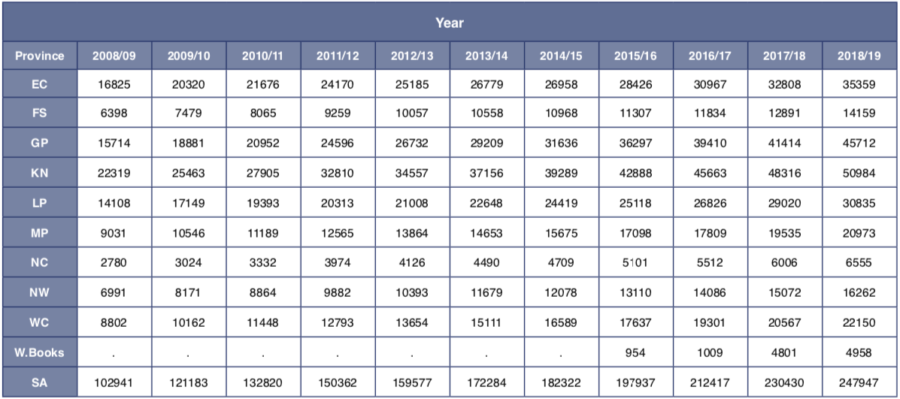
Table 23. CPI-Deflated Expenditure on Education: Compensation of employees (Millions of Rands, 2018 Rands)
Notes: 1. Provincial figures are comparable nominal EPRE figures adjusted for CPI inflation.
Table 24. CPI-Deflated Expenditure on Education: Capital accumulation (Millions of Rands, 2018 Rands)
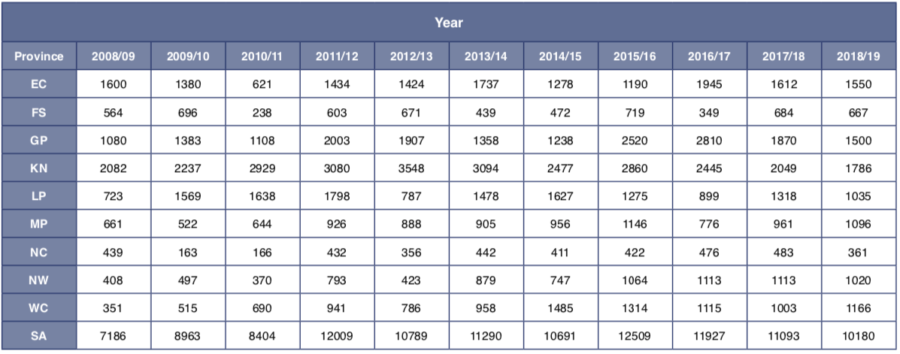
Notes: 1. Provincial figures are comparable nominal EPRE figures adjusted for CPI inflation.
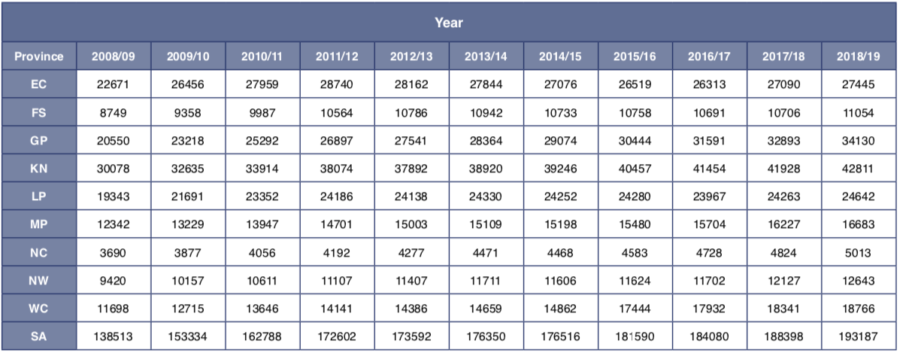
Table 25. CPI-Deflated Expenditure on Education: Current expenditure (Millions of Rands, 2018 Rands)
Notes: 1. Provincial figures are comparable nominal EPRE figures adjusted for CPI inflation. W.Books refers to learner workbooks which are nationally financed.
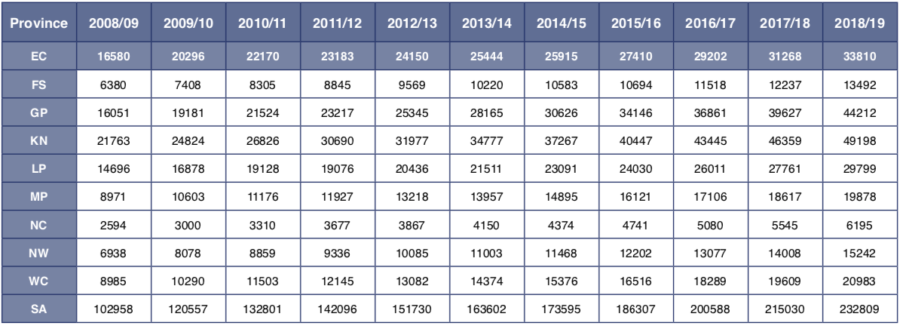
Table 26. All Enrolments GrR to Gr12: Public schools (Thousands)

Notes: *Values are additional students present in the published DBE enrolment report (School Realities, 2018) compared to the average of 2017 and 2019 enrolment figures from the same report. 1. Enrolment numbers are taken from governmental School Realities reports (DBE, 2008-2018).
Figure 19. Total per-learner expenditure deflated using BEPI-Persal
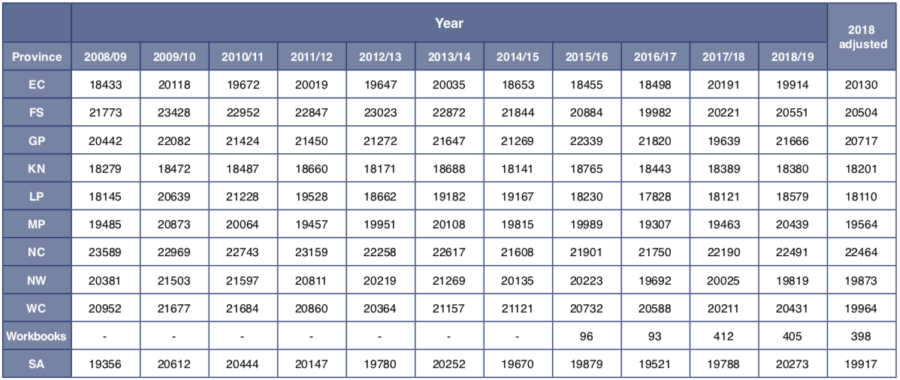
Figure 20. Total per-learner expenditure, deflated using BEPI-GG

Figure 21. Current per-learner expenditure, deflated using BEPI-Persal
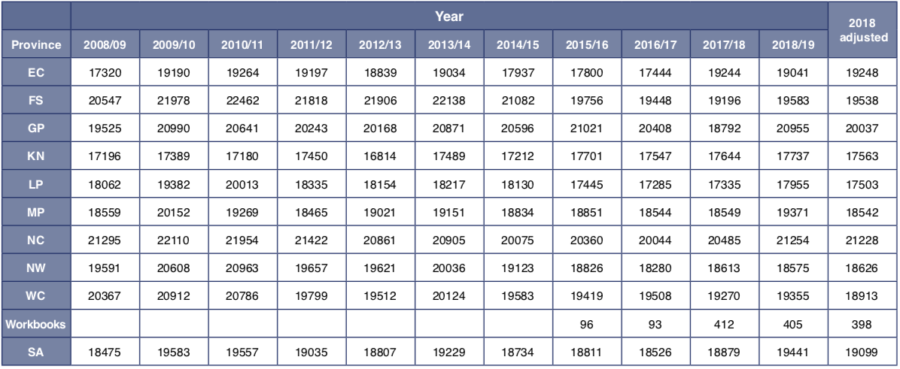
Figure 22. Current per-learner expenditure, deflated using BEPI-GG

Figure F1: Current expenditure per learner deflated with CPI only (2018 Rands)
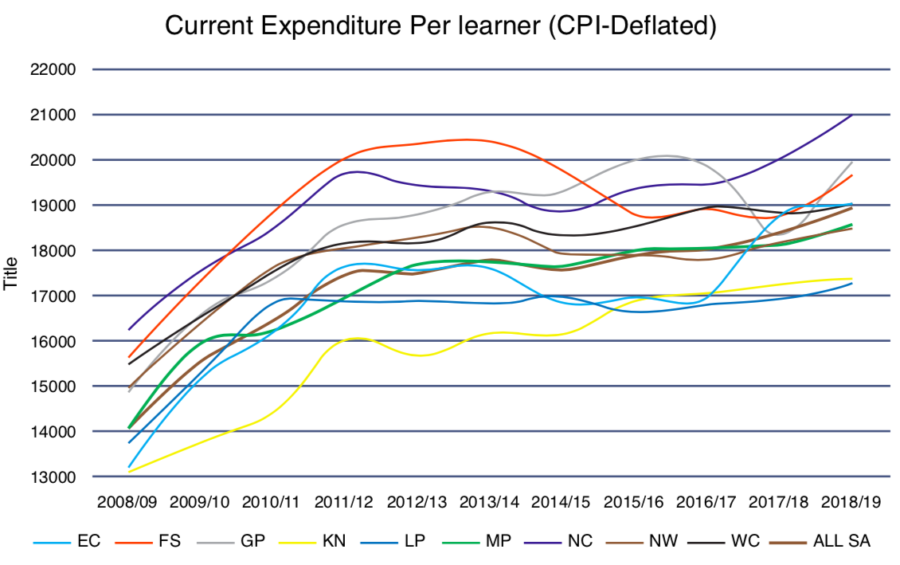
Table G1: BEPI-Persal calculated with CPI+1% inflation in non-personnel costs
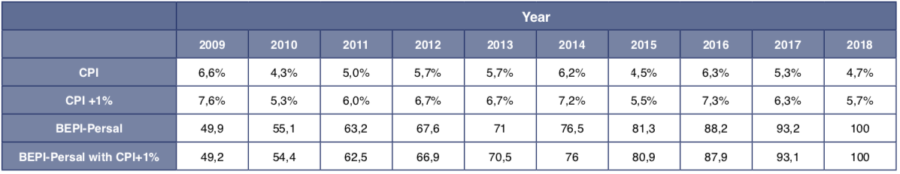
Figure G1: Current expenditure deflated using BEPI-Persal, calculated with CPI+1% inflation for non-personnel costs
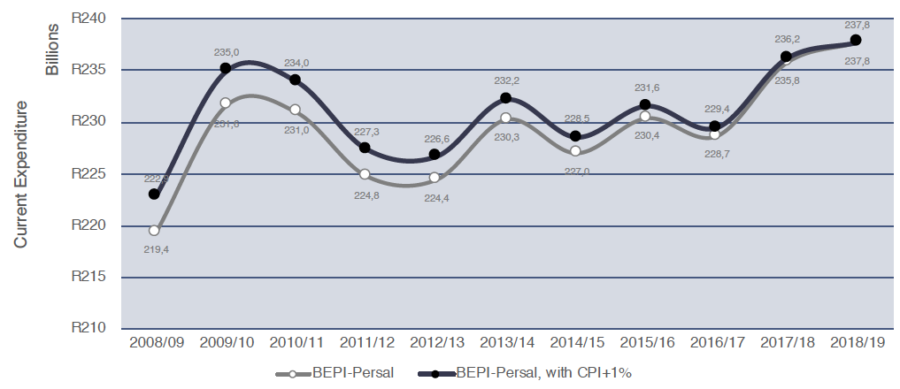
Figure G2: Per-Learner current expenditure deflated using BEPI-Persal, calculated with CPI+1% inflation for non-personnel costs
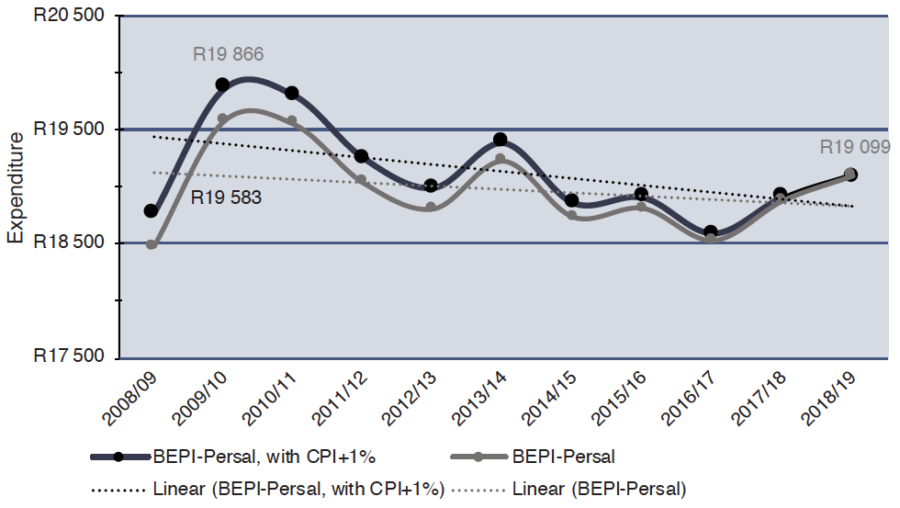
Table G2. Provincial per-Learner expenditure deflated using BEPI-Persal, calculated with CPI+1% inflation for non-personnel costs