19 May 2020
Common questions about South Africa’s Covid-19 response answered using the international OxCGRT dataset
For a rapid view of the key messages, go to the three ‘The short answer’ boxes below.
Introduction
This short report is a follow-up to my earlier working paper (Gustafsson, 2020), where I explored the use of a new University of Oxford dataset, OxCGRT, which captures on a daily basis the level of stringency of Covid-19 restrictions, as well as some other pandemic-related information. My working paper used the 14 April 2020 download of the OxCGRT dataset. Here I use the 16 May version.
I use the more recent download to answer three fairly common questions. The first question, about deaths, is not about restrictions, but obviously deals with the context of the restrictions. It is answered using the OxCGRT dataset, as this dataset includes imported WHO values on cases and deaths by day. The three questions are:
- 1. Is South Africa’s curve a relatively flat one?
- 2. Does South Africa have ‘one of the toughest lockdowns on earth’?
- 3. How do restrictions and ‘flattening the curve’ relate to each other, and where does South Africa fit in?
There are obviously limitations in attempting to answer these questions, especially the third one, using just one dataset and while devoting limited time to the analysis. These limitations are explained below.
Is South Africa’s curve a relatively flat one?
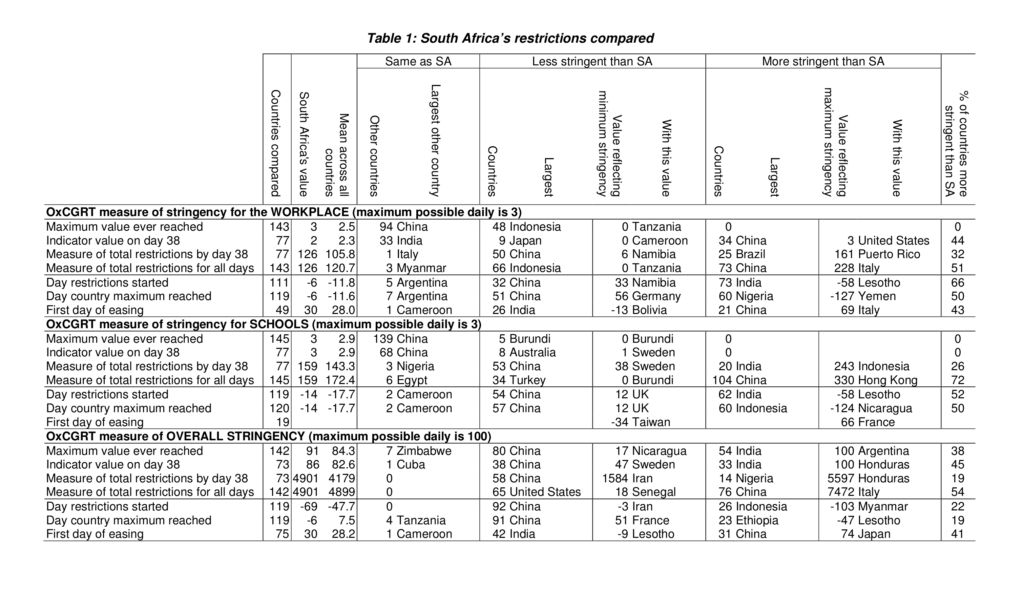
The short answer: South Africa is among the bottom one-fifth of countries when it comes to deaths by day 44 of the national trajectory of the pandemic, where the starting point is the day of the fifth death. In this calculation, Covid-19 deaths are considered in relation to deaths that would have occurred anyway in 2020. If one looks at raw, or absolute, numbers of deaths, then South Africa’s trajectory is about average. What is above average in the case of South Africa, is the rate at which deaths per day were accelerating by day 44. South Africa is far from being among the very worst countries in this regard, but it falls within the top half.
Figure 1 reflects a comparison considering only countries with a population of at least one million. Smaller countries are often small island states, with special dynamics, apart from being relatively unknown. The graph reflects 120 countries which, by 16 May 2020, had at least five reported Covid-19 deaths. 16 May 2020 was 44 days after South Africa had reached five deaths. By 16 May, 77 countries had experienced 44 or more days since the fifth death. Of these 77, 41 countries had experienced more deaths than South Africa’s 238 by day 44, and 35 had experienced fewer than deaths than this.
However, if one considers just the 48 countries with at least 44 days, but no more than 55 days since the fifth death, in other words countries which started to experience deaths at more or less the same date as South Africa, then South Africa ranks less favourably: 19 countries have higher (worse) values, and 28 countries have lower (better) values. Roughly, though, South Africa can be said to be near the middle of the group of comparator countries.
Figure 1: Cumulative deaths by country day
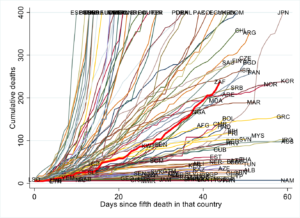
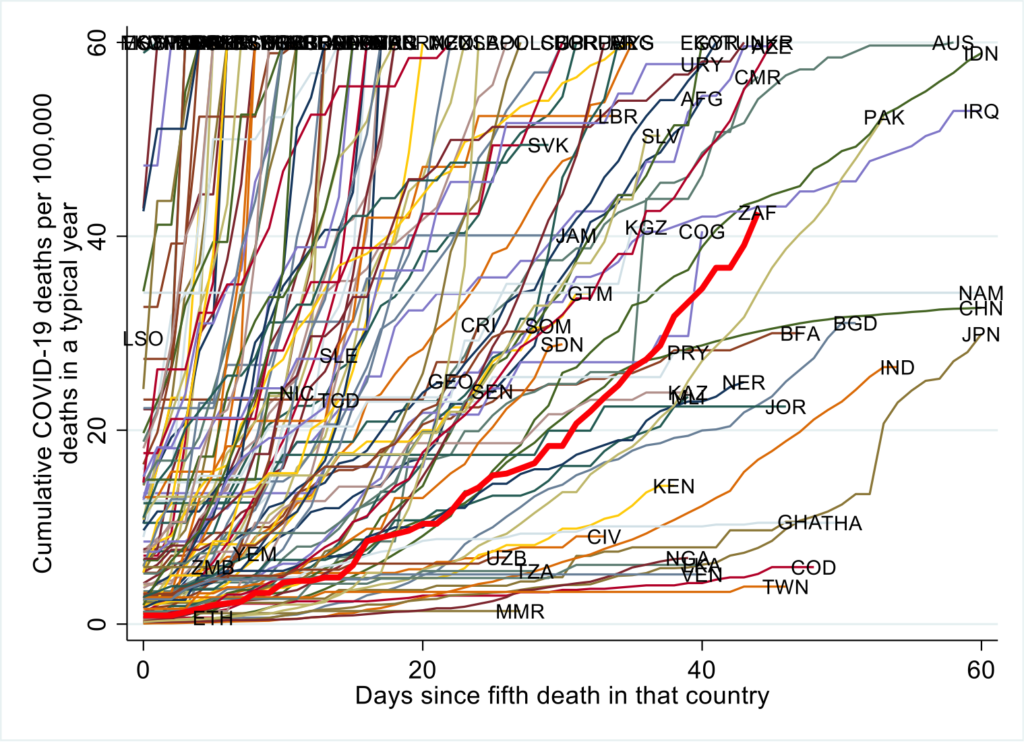
Figure 2 presents a comparison where South Africa’s ranking emerges as more favourable. Here Covid-19 deaths are expressed per 100,000 deaths one could expect anyway in 2020. Here, of the 77 countries referred to previously, 64 displayed a deaths ratio higher than South Africa’s, while just 12 displayed a ratio lower than South Africa. Thus South Africa was among the bottom one-sixth of countries. The 12 countries with better values than South Africa’s included China, Ghana, India, Japan, Namibia, Pakistan, Thailand and Taiwan. If one considers the 48 countries with roughly the same starting date as South Africa, South Africa still emerges with relatively good values: it is among the one-fifth of countries with the lowest deaths ratio by day 44.
Figure 2: Deaths ratio by country day
But is South Africa’s deaths curve flattening? One can see from the above two graphs that it is not. The slope of South Africa’s deaths curve (Figure 1) if one considers days 40 to 44 is 10.1, meaning there were around 10.1 new deaths per day. Ten days earlier, in the period 30 to 34 days, the slope was lower, at 8.5. If we divide 10.1 by 8.5, the resultant 1.19 can be considered a measure of the acceleration in deaths in South Africa. Of the 77 countries for which this measure could be calculated, 49 had a lower value than South Africa, suggesting South Africa was seeing a relatively rapid acceleration in deaths. This finding remains similar if one limits the comparison to countries, among the 77, with fewer than 500 deaths by day 44.
Does South Africa have ‘one of the toughest lockdowns on earth’?
The short answer: The international data do not clearly support the notion that South Africa has one of the most stringent set of Covid-19 restrictions in the world. Whichever way one looks at the data, South Africa emerges near the middle of all countries. For instance, 32% of countries had, by day 38 after the fifth death, experienced a higher total volume of workplace restrictions than South Africa. Such countries included Mauritius, Morocco and Malaysia. If one looks at how early countries began their workplace restrictions, 66% of countries were more stringent than South Africa, by beginning earlier, including Ethiopia, Colombia and Kenya.
An online BBC article of 12 May refers to South Africa’s Covid-19 responses as ‘one of the toughest lockdowns on earth’[1]. Similar labels can be seen elsewhere in the media. The OxCGRT dataset is probably the only dataset which allows one to verify how true this is. Table 1 below sums up key information from the dataset to answer the question. The OxCGRT dataset, in its new and revised format, includes an indicator of the overall stringency of movement restrictions. This now draws from eight sub-indicators dealing with restrictions in the following areas: schools, workplaces, public events, gatherings, public transport, home confinement, travel within the country, and international travel.
One important point should be underlined. The Oxford analysts who compile the OxCGRT dataset aim to capture the formal rules regarding restrictions. What they are not doing is looking at levels of compliance with those rules in the population.
The table pays particular attention to workplace restrictions because these are of particular concern as they affect people’s livelihoods. The workplace restrictions data were examined from six vantage points, from ‘Maximum value ever reached’ to ‘First day of easing’. This part of the table is discussed, in part as this helps to explain the general methodology.
A country can carry the values 1, 2 or 3 on any day for the workplace indicator. Of 143 countries which could be compared for ‘Maximum value ever reached’, South Africa and 94 other countries had reached level 3, the most stringent level. This would be roughly by the date of the data, 16 May. China is the largest country among these other 94. Among the 48 countries which by 16 May had never displayed level 3 restrictions were Indonesia (the most populous of the 48) and Tanzania, which displays the minimum of zero. Tanzania has essentially not implemented any workplace restrictions. It is not the only such country. There were eleven, including Eswatini and Taiwan. Tanzania would be the most populous of the eleven.
By day 38 after the fifth death, which would be 9 May in South Africa, the stringency of workplace restrictions had dropped to level 2. All day values refer to days after five deaths were registered in a particular country. There are no stringency values for South Africa beyond 9 May as there is a lag in the processing of the data at University of Oxford. A total of 77 countries had restrictions data for their day 38. Some countries would not have reached their day 38 yet, if deaths began occurring relatively late. By day 38, 33 other countries were on level 2, nine countries were at a lower level and 34 countries were at a higher level, meaning level 3. Clearly, according to this row of the table, South Africa was not among the most stringent restrictors.
Total restrictions up to day 38 would be all values up to that day added up. In South Africa, the total is 126. This is above the global average (across 77 countries) of 105.8. Here South Africa does emerge as displaying above average stringency. South Africa’s value of 126 is exactly the total in Italy by Italy’s day 38 (which would have been reached well before South Africa’s day 38). There were 50 countries with a lower value, including China, and 25 countries with a higher value, including Brazil. Brazil may seem surprising given what the media has said about President Bolsonaro’s resistance to most restrictions. However, Brazilian states have largely implemented restrictions despite the president’s position, and so the analysts at Oxford have concluded that workplace restrictions in that country were actually rather stringent. Among the 25 countries with a total restrictions value exceeding South Africa’s 126 would also be Mauritius (with 156), Nigeria (141), Morocco (138) and Malaysia (132).
The following row of the table, ‘Measure of total restrictions for all days’, adds up the workplace restrictions indicator values across all days, including days beyond day 38. Italy’s total value to date is 228, and this would also be the highest value in the world.
South Africa’s initial workplace restrictions began six days before the fifth death, hence the value -6. Of 111 countries, South Africa was not particularly early. The global average is 11.8 days before the fifth death. China emerges as less stringent than South Africa, meaning workplace restrictions were begun on a later day in that country. Namibia was the last of all 111 countries to impose workplace restrictions. This happened only 33 days after the fifth death. Another Southern African country, Lesotho, occupies the opposite extreme point in the world: in Lesotho, workplace restrictions were introduced 58 days before the fifth death. Close to Lesotho would be Ethiopia (-46), Colombia (-32) and Kenya (-24), all countries with more stringent values than South Africa’s -6.
On day -6, South Africa went straight to the maximum level 3 restrictions. Argentina was one of seven other countries which did the same. Germany was very late in reaching level 3. This occurred only 56 days after the fifth death. Nigeria was the largest country among the 60 countries reaching level 3 earlier than South Africa did (using, as before, each country’s individual timeline, not a universal calendar).
South Africa began easing workplace restrictions on day 30. Only 49 countries had data for this, as many countries had, by 16 May, not started easing restrictions yet. Of the 49, 26 eased restrictions earlier than South Africa, and 21 did so later. Italy only started easing restrictions 69 days after the fifth death. Among the 26 with earlier easings are Chile (-6, so six days before the fifth death) and New Zealand (12). Among the 21 with later easings are Morocco (day 52) and Malaysia (42).
The last column of the table helps to summarise the information in each row by providing the percentage of countries with more stringent restrictions than South Africa. These percentages roughly place South Africa somewhere in the middle of the rankings. The OxCGRT data do not obviously support the notion of South Africa’s restrictions being among the strictest in the world. Puerto Rico, Lesotho and Italy could qualify as having the most stringent restrictions, depending on how one viewed the data. Better candidates than South Africa for the ‘one of the toughest’ label would be Mauritius, Nigeria, Morocco, Malaysia, Ethiopia, Colombia and Kenya, but also several other countries.
Table 1 also provides details for the school closures sub-indicator in the OxCGRT data, and for the overall indicator of stringency. These parts of the table do also not support the notion of South Africa as a particularly stringent imposer of restrictions.
How do restrictions and ‘flattening the curve’ relate to each other, and where does South Africa fit in?
The short answer: There is no neat relationship between a country’s restrictions and ‘flattening the curve’. However, research is beginning to emerge on this relationship and it has revealed some interesting patterns, for instance the relative ineffectiveness of school closures in limiting the spread of the virus. Some crude modelling of the OxCGRT data suggests South Africa is fairly typical in terms of the reductions in Covid-19 impacts through movement restrictions.
Examining the relationship between restrictions and infections, or deaths, and specifically the question of the difference restrictions make to the impacts of the pandemic, is complex. So far, no studies of this kind have appeared using the OxCGRT dataset. However, a couple of studies have emerged using other datasets. Academics from a Swiss university (Banholzer et al, 2020) constructed their own restrictions dataset for twenty rich countries and arrived at some interesting findings. They found that workplace restrictions reduced cases by 31%, while school closures reduced cases by just 8%. Courtemanche et al (2020), using data from within the United States, also conclude that school closures are an exceptionally weak mechanism to reduce infections, relative other movement restrictions. This would be in line with emerging evidence on relatively low levels of transmission of the virus among children (see for instance the summary in Spaull [2020]).
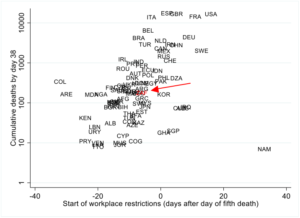
Figure 3 illustrates the relationship between how early workplace restrictions were imposed and cumulative deaths by day 38. The correlation coefficient between the two statistics is 0.40. The later the start of the restrictions, the higher the cumulative deaths. The analysis is crude, yet sufficient for the current discussion. South Africa (indicated by the red arrow) is clearly not unusual when it comes to how early restrictions began or cumulative deaths.
Figure 3: Cumulative deaths against start of restrictions
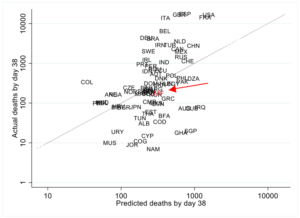
A very basic model ‘predicting’ cumulative deaths using just two explanatory variables, the start of the restrictions and the volume of workplace restrictions experienced by day 38, produced the following graph. Details of the model appear in the appendix. Given South Africa’s starting day (6 days before the fifth death) and total volume of workplace restrictions (126 points using the OxCGRT indicator), the model predicts 323 deaths by day 38 in South Africa. In reality, cumulative deaths had reached 238 by this day. The model thus suggests that South Africa’s restrictions were relatively successful in reducing the impact of Covid-19.
Figure 4: ‘Predicted’ and actual deaths
[1] Article titled ‘South Africa’s coronavirus lockdown: Doubts creep in’.
References
Banholzer, N., Van Weenen, E., Kratzwald, B., Seeliger, A. et al (2020). The estimated impact of non-pharmaceutical interventions on documented cases of COVID-19: A cross-country analysis. medRxiv.
Courtemanche, C., Garuccio, J., Le, A., Pinkston, J. & Yelowitz, A. (2020). Strong social distancing neasures in the United States reduced the COVID-19 growth rate. Health Affairs, 39(7).
Gustafsson, M. (2020). How does South Africa’s Covid-19 response compare globally? A preliminary analysis using the new OxCGRT dataset. Stellenbosch: University of Stellenbosch.
Spaull, N. (2020). Policy brief: Who should go back to school first? Stellenbosch: University of Stellenbosch.
Appendix
The following regression model informs Figure 4.
Table 2: Regression of restrictions on cumulative deaths
| Dependent variable → | Natural log of cumulative deaths by day 38 |
| Constant | 2.82** (2.15) |
| Day of first workplace restrictions | 0.071*** (2.83) |
| Total restrictions by day 38 | 0.076***(2.71) |
| above squared | -0.00039*** (-2.74) |
| N | 77 |
| Adjusted R2 | 0.149 |
| *** indicates that the estimate is significant at the 1% level of significance, ** at the 5% level | |
Download the PDF version below:
DOWNLOAD PDF