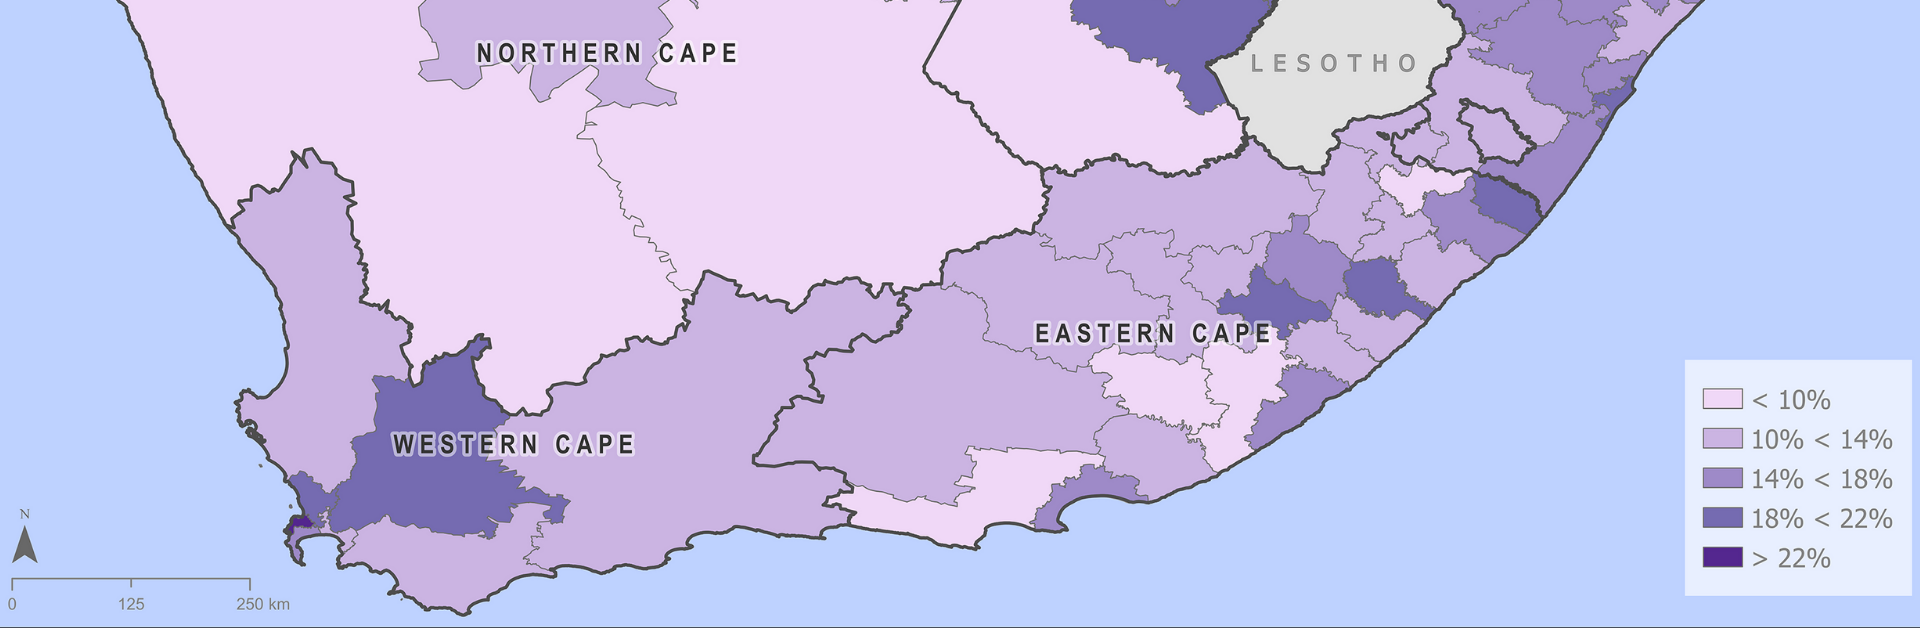
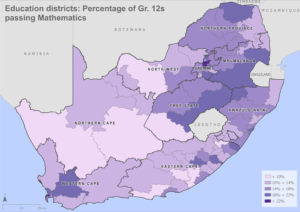
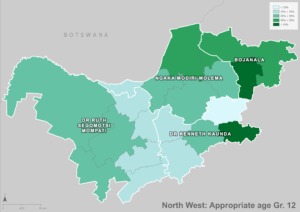
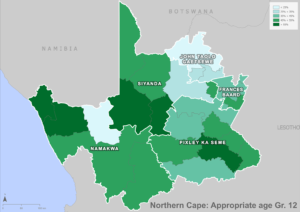
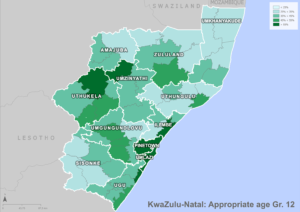
To illustrate the performance of South Africa’s public school system, RESEP developed the below interactive map with the assistance of the Centre for Geographic Analysis at Stellenbosch University. This tool toggles the data of learner flows at different grades and at different levels of the system including national, provincial, education district and ward levels. It is fully accessible to the public and can produce high-quality images for download.
Here are some examples of the types of maps that can be produced.
The map was developed in parallel to a report produced this year by RESEP researchers Servaas van der Berg, Chris van Wyk, Rebecca Selkirk, and Heleen Hofmeyr with the financial support of the Michael and Susan Dell Foundation. The team found that it takes high schools in South Africa an average of ten years to produce one successful matriculant. In essence, high schools have been operating at an efficiency rate of only 49%, if measured in terms of the years of enrolment in secondary school for every matric pass. Stated otherwise, at this rate, ten learner years at high school are required for every pass. This is because some who eventually matriculate only do so after having repeated once or more, but mainly because even more students spend some years in high school without ever reaching or passing matric.
Evidently, there are major inefficiencies in public spending on education. In addition to widespread repetition, high dropout rates are also a major source of inefficiency within the schooling system. In a labour market with a major skills shortage, drop-out from school is a waste of resources.
While hard to imagine, there are ways forward. For example, in an earlier study, one of the report’s co-authors, Chris van Wyk, used longitudinal cohort tracking of learner flows to show that targeted interventions in the Western Cape had substantially reduced repetition and improved education outputs, thereby enhancing the efficiency of the school system.