
Opportunity Gaps Among South African Girls
A full PDF version of this policy brief is available below.
Introduction
In April 2014, 276 girls were seized from their secondary school in the impoverished town of Chibok in North-eastern Nigeria. Their abduction swiftly captured the imagination of politicians and celebrities alike in the days and weeks to follow. The hashtag #BringBackOurGirls came to symbolise the apparent contradiction between global policy efforts to educate girls who were “…poor, born to parents of limited education and opportunities, from homes without distinction…” (Sesay, 2019: 4) and cultural norms that (sometimes violently) resisted the education of girls.
The media focus on the Chibok girls was short-lived. Like the Chibok girls, differences in educational opportunities available to South African girls of different circumstances can go unnoticed. A lot depends on the reference point that is used. Improvements in early access to schooling for girls of different backgrounds are rightly celebrated but there are persistent gaps that remain at different phases of schooling, many of which are reinforced by the nature of the out-of-school environment. It is true that girls’ educational attainment is increasing but perhaps the more pertinent question is how varied the schooling experience of female learners in South Africa continues to be (Zuze and Beku, 2019). This policy brief compares educational progress among South African girls across the socioeconomic spectrum to shed some light on which girls are actually succeeding academically and which ones are being left behind.
1. Opportunity gaps among South African women begin early and linger into adulthood.
The quality of life of South African women depends on their experiences while at school and in their communities. There is a distinct divide in the quality of health services, nutrition, safety, housing and access to educational enrichment programmes for girls who are in poverty and girls who are born into wealth. These gaps start early and continue into adolescence and adulthood. Figure 1 summarises disparities in important livelihood outcomes among South African women who are 15 years and older.2 We compare outcomes for women in the lowest wealth quintile (the poorest) and the highest wealth quintile (the wealthiest).
Educational progression is much lower for poor women. Only 2% of the poorest study beyond secondary school compared to 34% of the wealthiest. Close to three-quarters (74%) of South Africa’s most disadvantaged women were unemployed in the twelve months preceding the study. Among the employed, only 3% of the poor are in professional or managerial positions. In contrast, 43% of the wealthiest women are unemployed and 38% of the employed are in professional roles.
The differences don’t end there. While only 7% of the wealthiest teenagers had started childbearing, one in five (20%) of the poorest teenagers had already given birth. Reliable savings and credit facilities make it easier to start and expand a business. Assets can be a vital safety net for women in times of need. Without these services, women are left with few credible options when crises occur. Here too, the opportunity gap is striking. There is a 51-percentage point difference in bank account uptake and an 8-percentage point difference in house ownership between the poorest and wealthiest women.
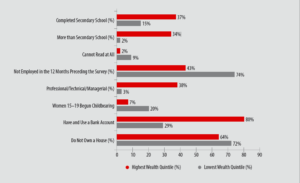
FIGURE 1: Education and Employment Characteristics of South African Women, 2016
Source: (National Department of Health (NDoH) et al., 2019) – own calculations
The focus of outside influences on schooling tends to be on the role of parents and caregivers, but there is another angle to consider. If girls spend most of their time outside of school doing domestic work, then they cannot prepare adequately for school. It can also mean that they arrive at school tired and unable to concentrate. The reality is that in poor households, parents may have little choice but to rely on children to assist with running the home or helping with a family business. In Figure 2, we combine information on household chores to form an index of domestic tasks. Higher values on the index mean greater household responsibilities for girls. The graph is shown by SES quintiles where quintile 1 refers to the lowest SES girls and quintile 5 to the highest SES girls. The contrast between the weight of domestic responsibilities for low-SES learners and the lighter load for their high-SES peers is apparent. The availability of discretionary time depends on girls’ out-of-school circumstances.
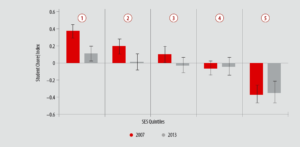
FIGURE 2: Grade 6 South African Girls and Domestic Tasks by SES Quintile, 2007 and 2013a
Source: (SACMEQ, 2017) – own calculations a. 95% confidence intervals are shown above each graph.
2. Academic achievement is worse for girls from high-poverty schools but girls of different backgrounds grapple with self-confidence.
We can use South Africa’s participation in international studies to test how patterns of inequality show up in standardised assessments. Girls are under-represented in science, mathematics and technology (STEM) professions. There are a wide range of interventions to support women who aspire to STEM careers, with some proving to be more effective than others (Koch and Irby, 2014). In Table 1, we consider the percentage of Grade 9 girls in no-fee, fee-paying and independent schools who achieved scores below the TIMSS2 400 minimum benchmark. This threshold represents a basic knowledge of mathematics. While the percentage of South African girls who are below the cut-off has declined over the years, most girls in public schools are still without basic mathematical skills. The situation among girls attending no-fee public school is particularly worrying. As recently as 2015, four out of five scored below the lowest benchmark. Contrast this with one in five in independent (‘private’) schools; girls who would automatically have many more options to enter the STEM market in the future.
TABLE 1: Percentage of Grade 9 Girls in South Africa below the TIMSS Mathematics International
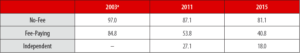
Source: (Mullis et al., 2016)– own calculations a. Only public schools were assessed in 2003.
To test whether there has been any improvement in equity outcomes among social groups, we used the SACMEQ3 mathematics test results for 2000, 2007 and 2013.4 Each of the lines in Figure 3 represents the predicted student test scores for a round of SACMEQ. Between 2000 and 2007, the relationship between SES and achievement was remarkably similar. Girls of a lower SES achieved test scores below the SACMEQ average of 500 and girls of a higher-SES did considerably better. By 2013, while overall performance had improved and the majority of girls achieved a score above the 500 mark, the slope of the line was the same as before. What this result suggests is that the influence of SES on achievement differences among South African girls has not lessened during this period.
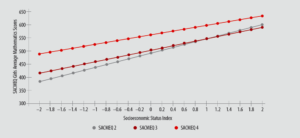
FIGURE 3: SES-Achievement Gradient for Grade 6 South African Girls: 2000-2013
Source: (SACMEQ)– own calculations
Research has shown that girls tend to approach technical subjects with more anxiety than boys, even if they are competitive in these subject areas (OECD, 2018). In Figure 4, we explore whether levels of confidence depended on their schooling environment. We compared the percentage of Grade 5 and Grade 9 girls who stated that they were not confident in their mathematical ability (as opposed to being confident or very confident) across school category. There was a significantly higher percentage of girls in Grade 5 public schools who were not confident in mathematics in comparison to Grade 5 girls in independent schools. Lack of confidence increases for girls attending secondary school. There were no statistical differences based on the type of school that Grade 9 girls attended.
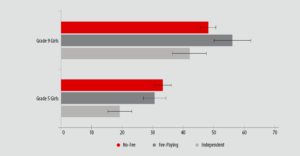
FIGURE 4: Percentage of Grade 5 and 9 Girls in South Africa Not Confident in Mathematics below the TIMSS Mathematics International Benchmark, 2011 and 2015a
Source: (Mullis et al., 2016) – own calculations a. 95% confidence intervals are shown above each graph.
3. Rural-urban disparities favour girls from urban and suburban schools.
The experience of the Chibok girls underscores that cultural beliefs in remote communities with widespread poverty can limit girls’ education. Domestic responsibilities (such as collecting firewood, working in the fields after school, cooking and fetching water) are time-consuming in traditional rural settings (Aikman and Unterhalter, 2007; Levison and Karine, 1998). Excessive domestic chores can be as detrimental to the education of girls as child labour (Yonatan, 2019).
If marriage and childbearing are prioritised over the education of girls, parents in rural areas might not see the value of sending girls to school (Zuze, 2015). When these beliefs collide with relatively low quality of rural education, it is easy to see why the average achievement of girls in rural and small-town schools is significantly lower than for girls attending urban and suburban schools. Table 2 shows that there was a one standard deviation difference in the average mathematics test scores between girls in suburban schools and girls in rural schools in 2015.
TABLE 2: Achievement Differences in Mathematics and Science Among Girls by School Location, 2015
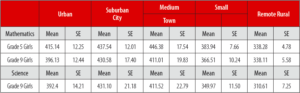
Source: (Mullis et al., 2016) – own calculations
4. Implications for Further Research.
1. The destinies of South African girls are diverging. While progress has been made in girls’ education, many South African girls are at risk of educational failure. Girls from poor homes have less discretionary time outside of school to focus on their studies or to participate in enrichment programmes. Fewer disadvantaged girls acquire foundational knowledge in mathematics and the positive relationship between socioeconomic status and academic achievement is as important today as it was in the past among South African female learners.
2. Girls of different backgrounds face similar socio-emotional challenges about mathematics. Poor self-confidence about mathematics is common for girls, irrespective of the type of school that they attend. To improve the representation of women in STEM professions, we need to understand when and how girls’ self-expectations about technical subjects are formed. Building capacity among mathematics educators in low-resourced school is crucial to lifting the participation of girls in mathematics and science.
3. The collision between social norms and educating girls threatens to reverse the gains made in basic education. Internationally, girls who live in poor and remote areas may face discrimination and violence for attending school. The social and cultural challenges that South African girls face might be less obvious but they certainly exist. As South Africa’s economic outlook worsens, it is perhaps more important than ever that girls in high poverty areas receive the support that they need from family, peers and educators so that they succeed academically.
5. References
Aikman, S., & Unterhalter, E. (2007). Practising Gender Equality in Education. Oxford: Oxfam.
Koch, J., & Irby, B. (2014). Introduction. In J. Koch, B. Polnick, & B. Irby (Eds.), Girls and Women in STEM. A Never Ending
Story. Charlotte, N.C.: Information Age.
Levison, D., & Karine, S. M. (1998). Household Work as a Deterrent to Schooling: An Analysis of Adolescent Girls in Peru.
The Journal of Developing Areas, 32(3), 339-356. www.jstor.org/stable/4192776.
Mullis, I. V. S., Martin, M. O., Foy, P., & Hooper, M. (2016) ‘TIMSS 2015 International Results in Mathematics’. Boston
College, TIMSS & PIRLS International Study Center TIMSS & PIRLS International Study Center Available at: https://
timssandpirls.bc.edu/timss2015/international-results/.
National Department of Health (NDoH), Statistics South Africa (Stats SA), South African Medical Research Council
(SAMRC), & ICF (2019) ‘ South Africa Demographic and Health Survey 2016’. Pretoria, South Africa, and Rockville,
Maryland, USA: NDoH, Stats SA, SAMRC, and ICF.
OECD (2018) ‘Equity in Education: Breaking Down Barriers to Social Mobility’. Paris: OECD Publishing.
SACMEQ (2017) ‘Southern and Eastern Africa Consortium for Monitoring Educational Quality. SACMEQ IV Project,’
SACMEQ. Paris: International Institute for Educational Planning, UNESCO
Sesay, I. (2019). Beneath the Tamarind Tree. Blackstone Publishing: Ashland, Oregon.
Yonatan, D. (2019). The Impact of Public Works Programme on Child Labour in Ethiopia. South African Journal of
Economics, 87(3), 283-301.
Zuze, T. L. (2015). A Riddle Explained: Gender Disparities in East African Education. African Review of Economics and
Finance, 7(2), 29-59.
Zuze, T. L., & Beku, U. (2019). Gender Inequalities in South African Schools: New Complexities. In N. Spaull, & J. D.
Jansen (Eds.), South African Schooling: The Enigma of Inequality. A Study of the Present Situation and Future Possibilities
(pp. 225-241). Cham, Switzerland: Springer.
[1] We used data from the 2016 South African Demographic and Health Survey for this table, a nationally representative study of demographic and health indicators. [2] Trends in International Mathematics and Science Study. TIMSS International provides a set of international benchmarks so that participating countries have comparable descriptions of what learners know. [3] Southern and Eastern African Consortium for Monitoring Educational Quality. SACMEQ assessments are standardised to a mean of 500 and a standard deviation of 100 for all students. SACMEQ 2, 3 and 4 were administered in 2000, 2007 and 2013 respectively.
[4] The student SES variable was derived based on the availability of a list of assets in a learner’s home. We developed a continuous variable for student socioeconomic status based on information on household assets and standardised the measure to a mean of zero and a standard deviation of 1.
Download the full PDF version of this policy brief below.
DOWNLOAD PDF